Chart Sharing
Starting with PixieDust 1.1.1, the PixieGateway server now supports sharing of charts created with the display() function, effectively turning them into standalone web pages. No coding necessary.
Simply use the interactive PixieDust display() function from within a Jupyter Notebook to build your chart, click on the Share button, add an optional description. You’ll get a URL. Visitors to your page will see the chart without needing to run a Jupyter Notebook. All they need is a web browser.
Chart Sharing in Action
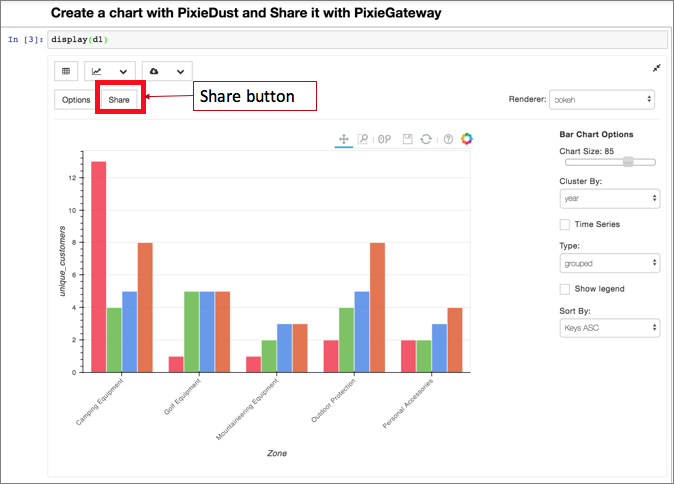
Using display() to create a chart, you’ll now see a Share button next to “Options”:
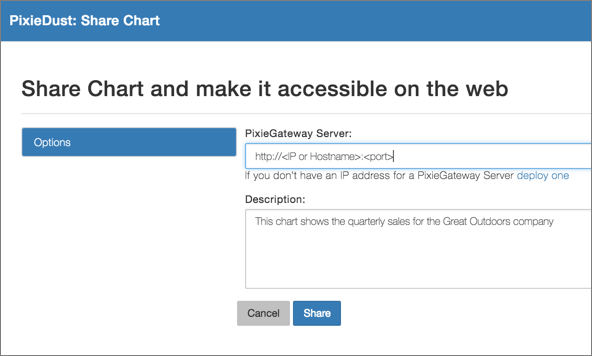
The Share dialog will ask for the following information:
- PixieGateway server: If you don’t have one, see the docs for instructions on how to set one up.
- Description: Optional free-form text explaining what the chart is about. It will be added to the standalone webpage.
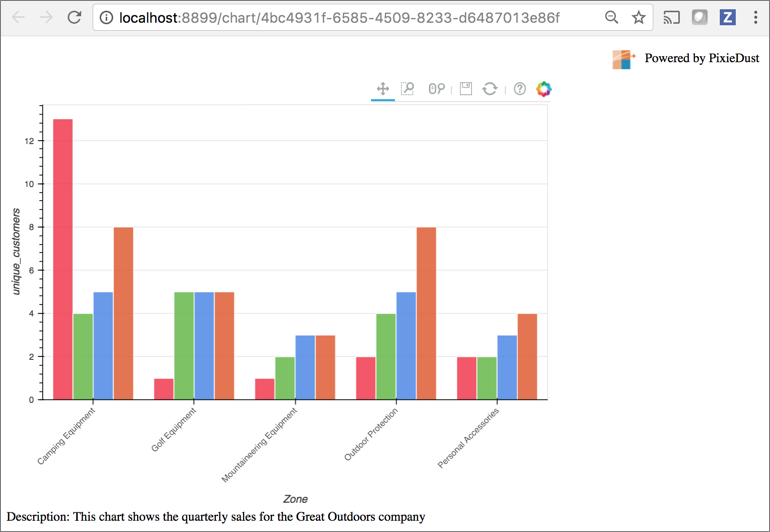
Click Share, and if all goes well, you should get a URL for your chart webpage that is ready to share:
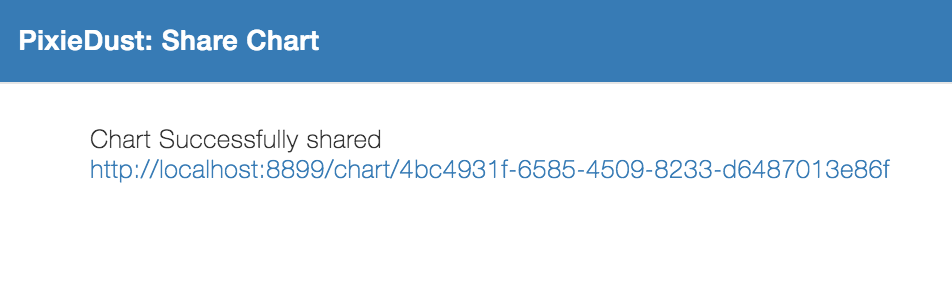
You can copy the URL or click on the link to go directly to the page: